Nowadays, technology has evolved so far that with monitoring solutions, anybody can get information about what they need anywhere and anytime. Problems can start with cost, so let’s look at what can be done with one of the cheapest as well as the smallest computer – Raspberry Pi and a couple of sensors.
Monitoring
Let’s start with what exactly is monitoring. Monitoring – systematic process of collecting, analyzing and using the information to eliminate any problems as soon as possible. Monitoring is most commonly used in IT infrastructures, where it is necessary to constantly monitor the infrastructure to eliminate problems as quickly as possible.
Raspberry Pi
Monitoring can vary from how it is monitored and with what it is monitored. For monitoring will be used Raspberry Pi – a credit card seized computer and a pair of sensors. Raspberry Pi is a computer based on Linux operating system and the main features are size, price, and usability.
Sensors
One of the features of the Raspberry Pi is that it can connect a variety of sensors. As an example, the server room will be monitored. Three types of sensors will be used for server room monitoring: door sensor, temperature and humidity sensor, and smoke sensor.
The sensors can be connected to Raspberry Pi “GPIO” pins or via a breadboard, which allows you to connect more and more complex sensors that require, for example, resistors and converters.
Sensor installation
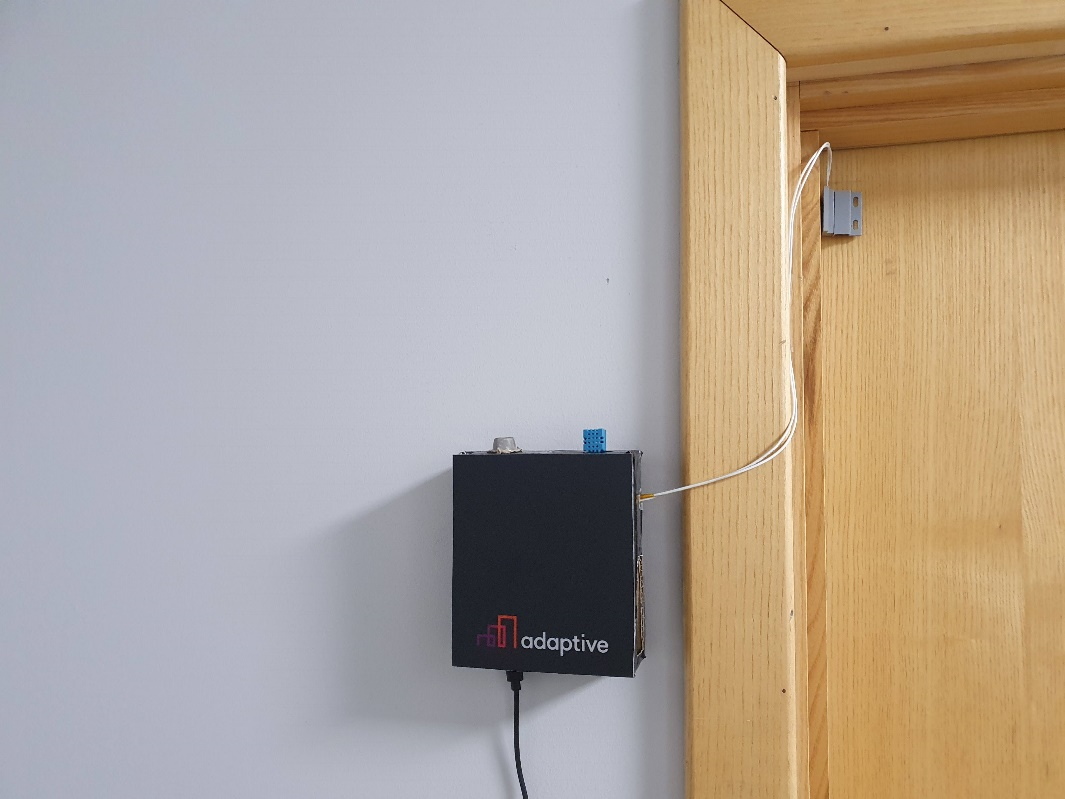
Once the sensors are connected and configured with the Raspberry Pi, they need to be installed in the desired room. Raspberry doesn't offer a case for the computer itself along with the breadboard and sensors, so you need to improvise. We chose the cheapest way and made the case out of cardboard, but if you want to make the project a little more elegant, the body can be created, for example, from plastic with the help of 3D printing.
The housing in the server room is attached to the wall and the door sensor to the door (see Picture).

Zabbix
Zabbix is a software that allows you to constantly retrieve data from a variety of devices over a network, thus monitoring them.
Zabbix monitoring is made possible by using technologies such as SNMP, JMX, IPMI as well as its own agent or Zabbix Agent, which in our case will also be used for server room monitoring. Zabbix Agent is installed on the device and responds to items created on the Zabbix server that determine what the agent should do, such as read line 1 of a text file. With the help of such items, the necessary data is constantly obtained and compiled.
Grafana
Grafana is software that allows you to visually display data. It is possible to create tables, charts, and many other things to display data so that users can create the best monitoring for themselves.
A big plus for Grafana is its compatibility with Zabbix. With the use of Zabbix plugin, Grafana accesses and visualizes the data collected by Zabbix over the network.
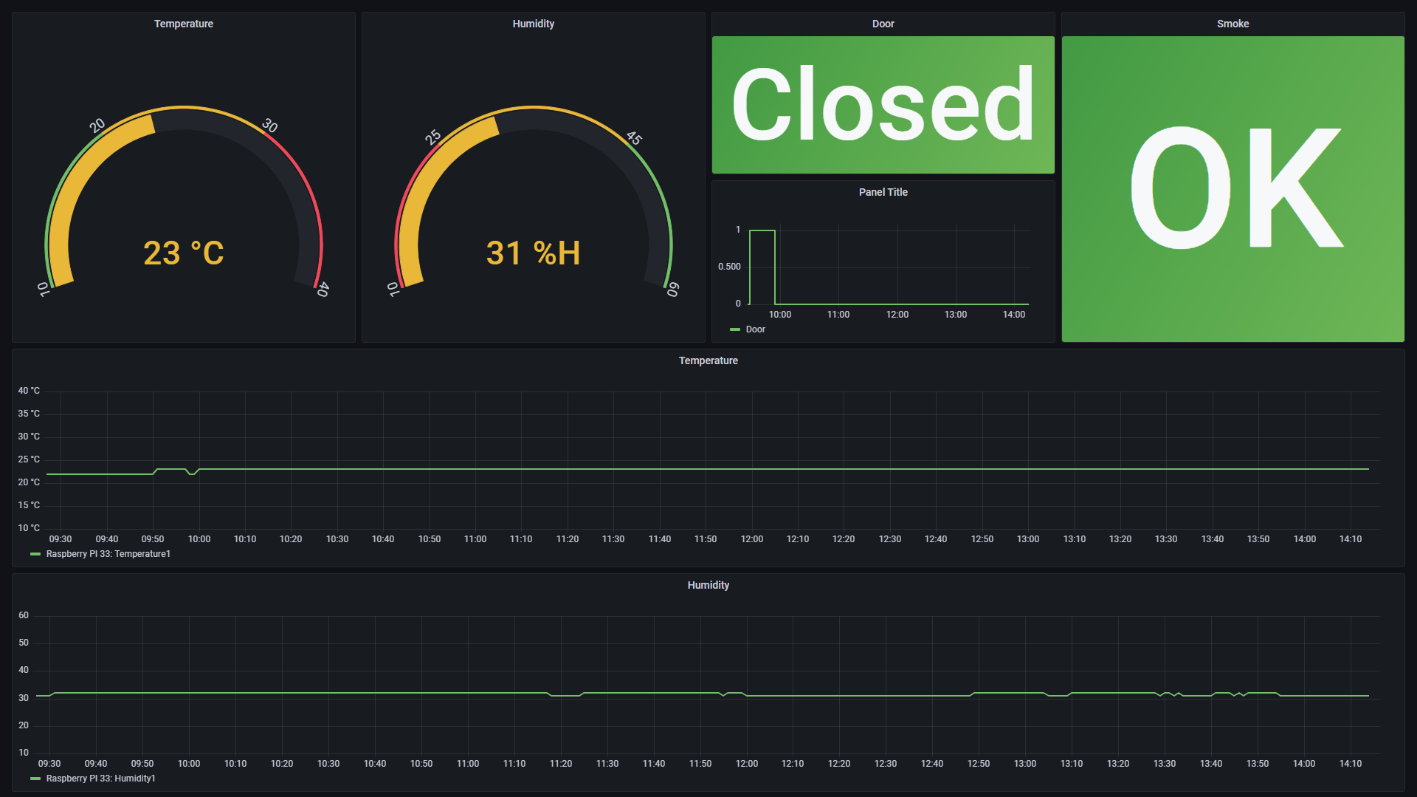
Collected data using Raspberry Pi and Zabbix, we visualize and get a dashboard like this

The graph shows:
- Current temperature,
- Humidity,
- Status of the door, below which a graph showing the time when the door was open,
- A smoke detector that would indicate leakage in the event of a smoke or gas leak,
- Below the main gauges is a graph with temperature and humidity lines, which shows changes in the last 6 hours.
If you want to monitor your server space, or just want to talk about monitoring solutions from different manufacturers, contact Adaptive and we will find the most suitable solution for you.


